Population density and building age in Barcelona
Barcelona’s urban form carries its history in its buildings. The historic core is dense and old; the outer ring is newer and more spread out — but how clearly does that pattern hold at the census-section level? This project combines building-age data from the Cadastre with population data from the municipal census, joining them onto the official geospatial boundaries to produce a bivariate map.
Data sourced from the Ajuntament de Barcelona Open Data Portal.
Result
The bivariate colour scheme encodes two variables simultaneously: building age (x-axis of the legend) and population density (y-axis). Dark blue-purple = old and dense; light grey = new and sparse.
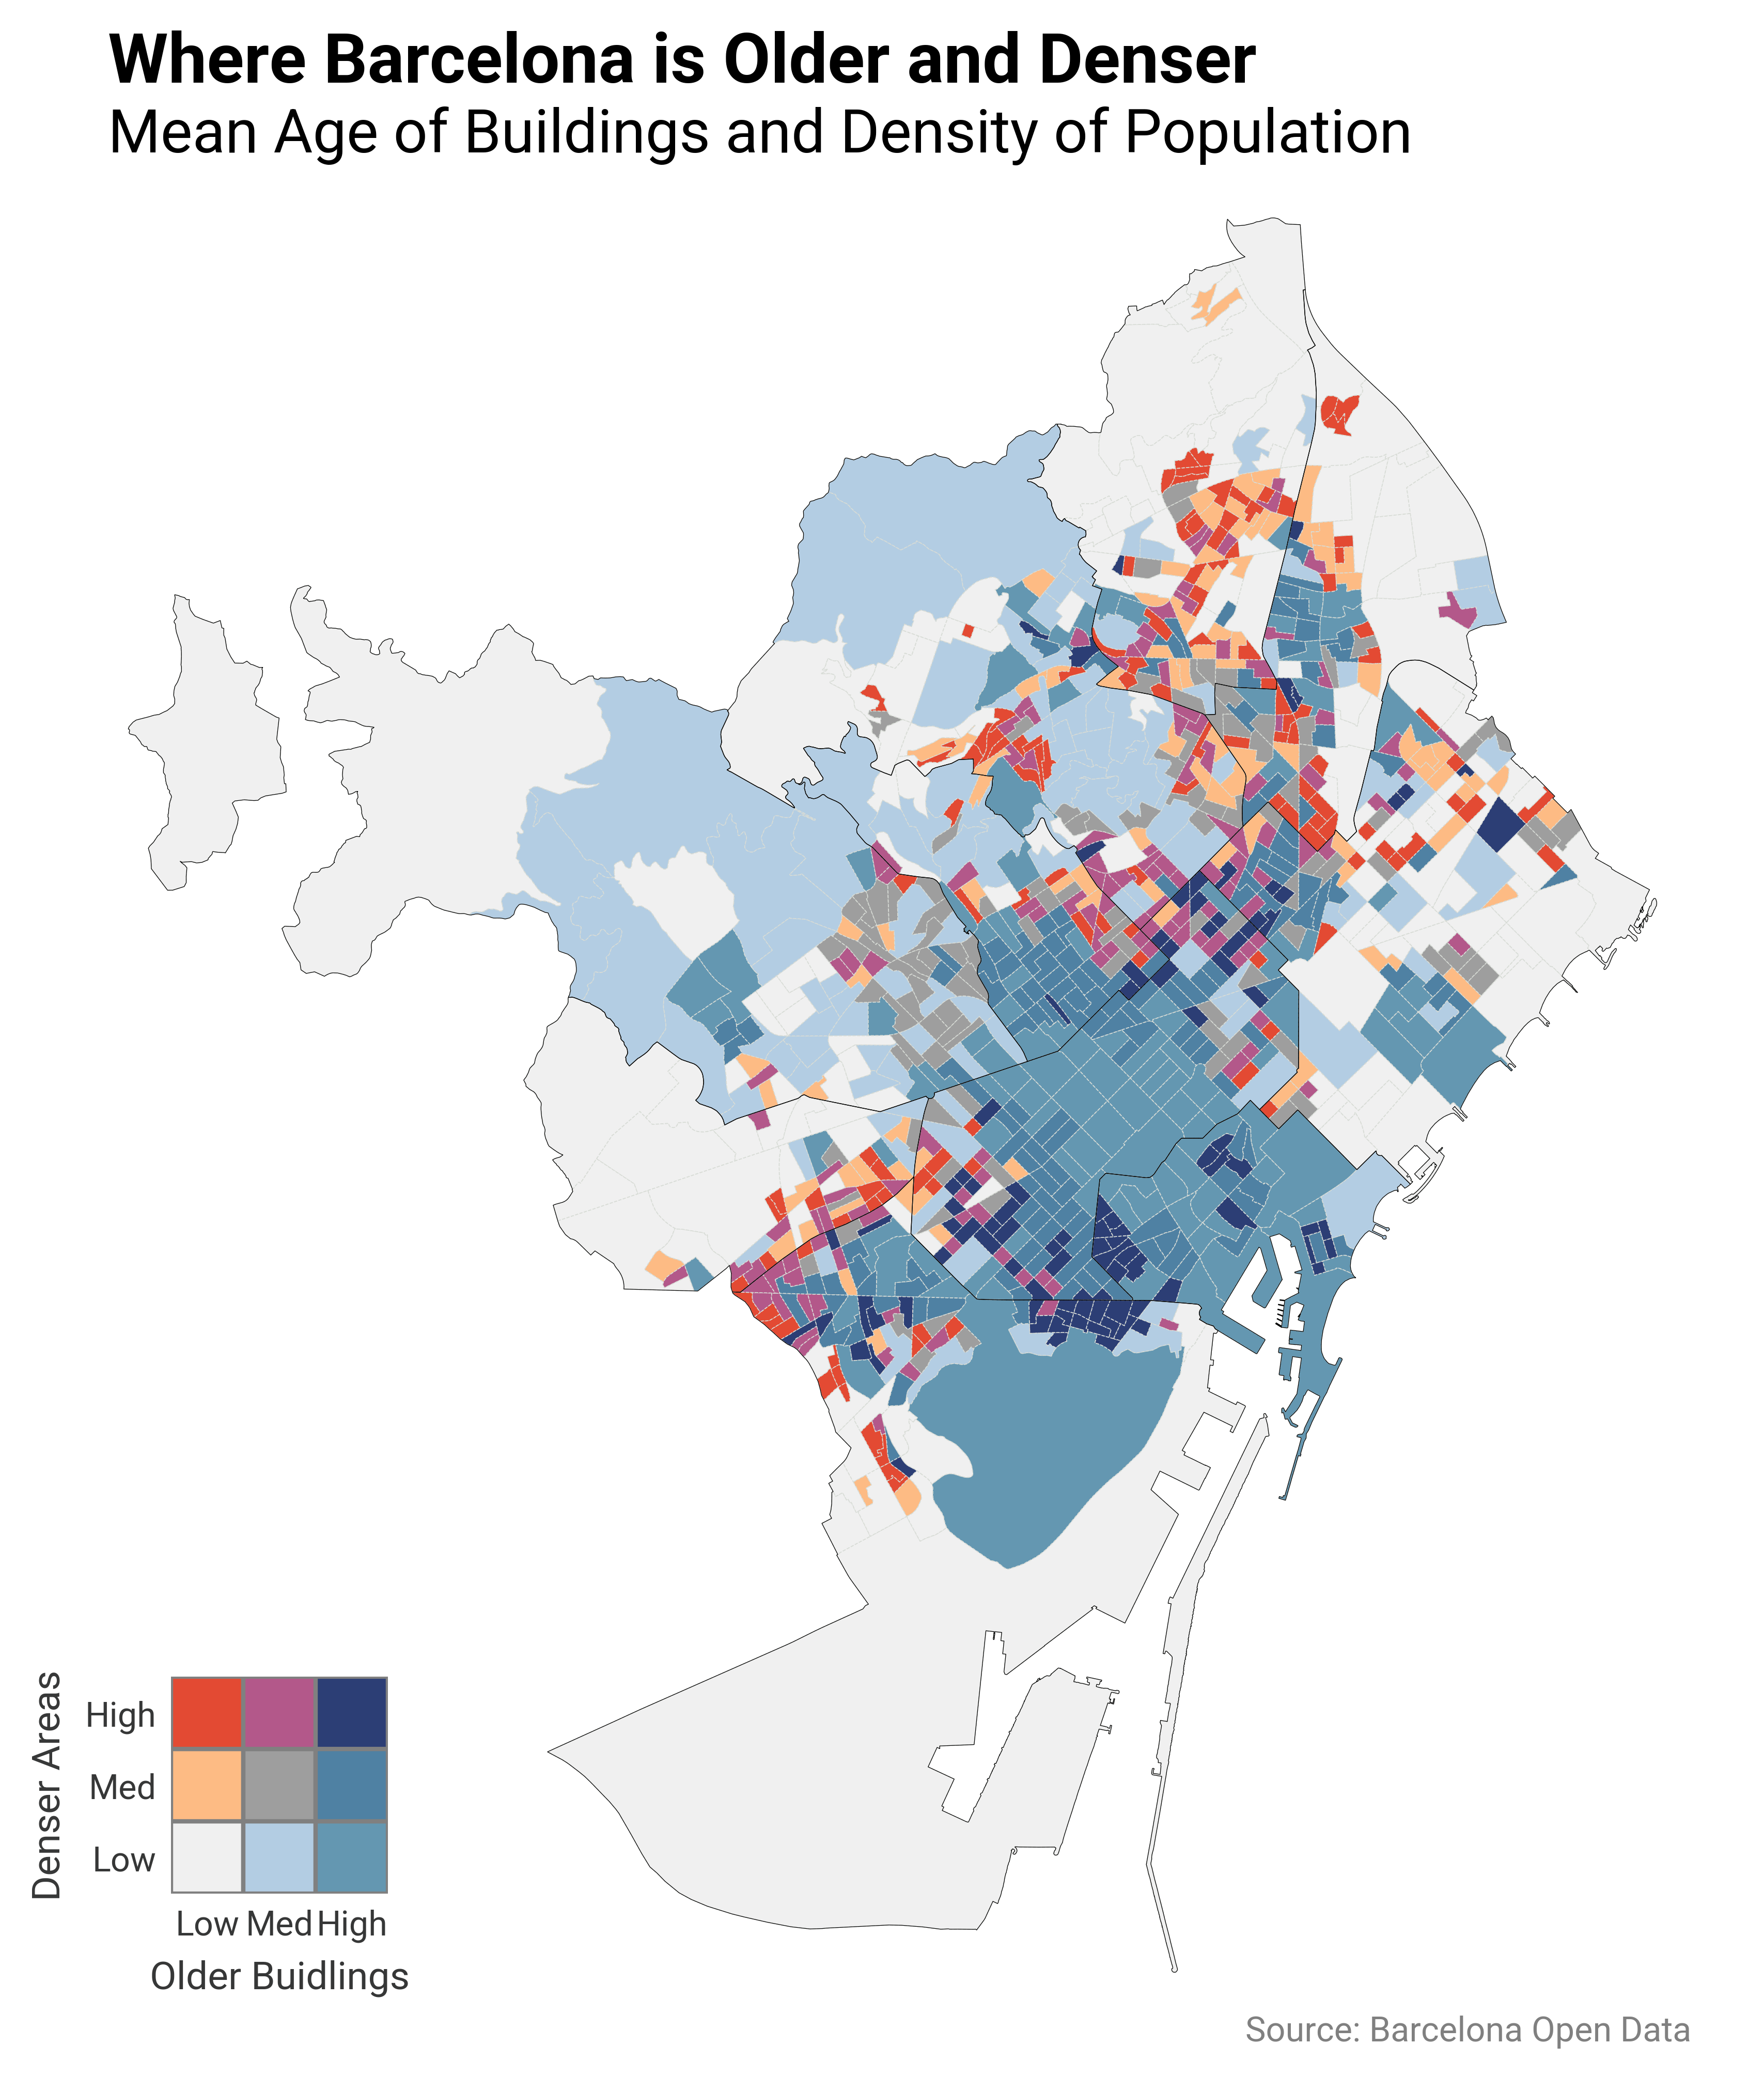
Instead of looking at a single variable, I tried to combine two: population density and the average age of buildings across Barcelona.
What I found interesting is that looking at them together tells a more nuanced story:
- In the historic core there is a pocket of high density and high building age in Raval, less so in Ciutat Vella
- But there are also pockets of relatively old buildings outside the very center, with high population density. Poble Sec is particularly striking.
- There is also a stark contrast between the Eixample Esquerra and Eixample Dreta
- And some dense areas that are not particularly old, hinting at more recent urban development
So rather than a simple “old center vs new outskirts” narrative, the city feels more heterogeneous, shaped by different waves of growth and transformation.
Full analysis
The complete data pipeline — loading five geospatial datasets, merging them, computing quantile-based bivariate classes, and producing all visualisations — is in the notebook that can be downloaded here.