# libraries and imports
import sys
import requests
import pandas as pd
import numpy as np
import matplotlib.pyplot as plt
plt.style.use('../matplotlib.mplstyle')Open Access status in time
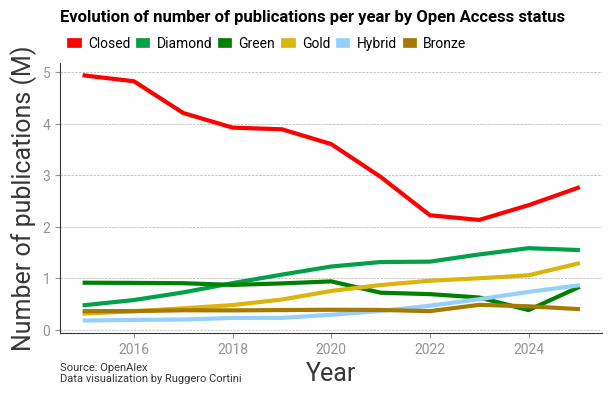
In this study, we will get data from OpenAlex to extract data on how the Open Access status of publications has evolved in the past 10 years.
# first, we define a handy function that will help us perform queries to the OpenAlex APIs.
def send_query(url, params, print_query=False):

        # perform the request using the specified URL and parameters
        r = requests.get(url, params)

        if print_query:
            print(r.request.url)

        # check the status code of the request
        if r.status_code != 200:

            if r.status_code == 414:
                raise ValueError("""API error: {}""".format(r.reason))
            else:
                import ast
                err = ast.literal_eval(r.text)
                raise ValueError("""API error:\n\tERROR  :  {error}\n\tMESSAGE:  {message}""".format(**err))
        else:

            # if there is no error return the JSON object for the results
            return r.json()
# then, we obtain the data, starting from MIN_YEAR and ending at MAX_YEAR, both included
MIN_YEAR = 2015
MAX_YEAR = 2025
OA_API_URL = 'https://api.openalex.org'
oa_status_year = {}
for year in range(MIN_YEAR, MAX_YEAR+1):
# build the URL for the request
URL = f'{OA_API_URL}/works'
tmp = send_query(
URL,
params={'filter':f'type:article,publication_year:{year}', 'group_by':'oa_status'})['group_by']
oa_status_year[year] = pd.DataFrame(tmp).set_index('key')['count'].rename('npapers')oa_status_year = pd.DataFrame(oa_status_year)
oa_status_year.sum()2015 7207568
2016 7246654
2017 6853936
2018 6810353
2019 7087018
2020 7227151
2021 6644701
2022 6043447
2023 6322328
2024 6655393
2025 7691611
dtype: int64# prepare data
plot_df = (oa_status_year/1e6).T
order_status = plot_df.sum(axis=0).sort_values(ascending=False).index
plot_df = plot_df[order_status]
# init figure
fig, ax = plt.subplots(figsize=(7,3.5))
# color mapping
colors = {
'closed':'red',
'gold':'xkcd:gold',
'bronze':'xkcd:bronze',
'green':'green',
'hybrid':'xkcd:light blue',
'diamond':'xkcd:emerald'
}
for col in plot_df.columns:
plot_df[col].plot(
color=colors[col],
linewidth=3,
label=col.capitalize(),
ax=ax
)
ax.set_xlabel('Year')
ax.set_ylabel('Number of publications (M)')
# legend
leg = ax.legend(title='', ncols=6, loc='lower left', bbox_to_anchor=(0,1), handlelength=0.3, columnspacing=0.8)
for legobj in leg.legend_handles:
legobj.set_linewidth(7.0)
ax.set_title('Evolution of number of publications per year by Open Access status', loc='left', pad=30, fontsize=12, fontweight='bold')
ax.grid(axis='y', linestyle='--', linewidth=0.5)
ax.text(2014.5, -1., "Source: OpenAlex\nData visualization by Ruggero Cortini", color='xkcd:dark grey',fontsize=8)
fig.savefig('n_year.png', dpi=600, bbox_inches='tight')